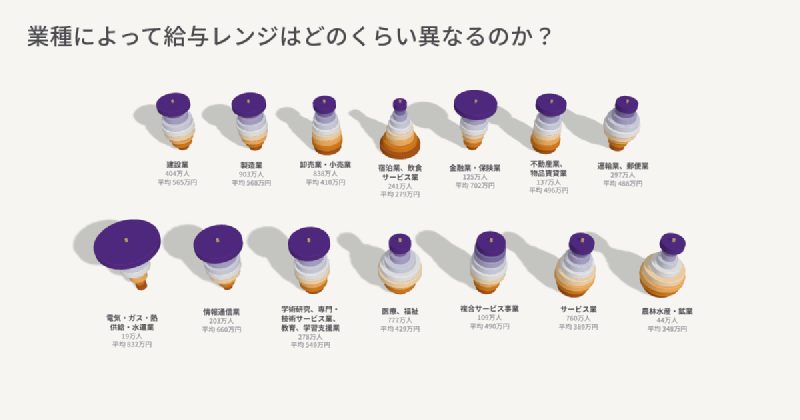
Compare how many people work in each salary range across 14 Japanese industries.
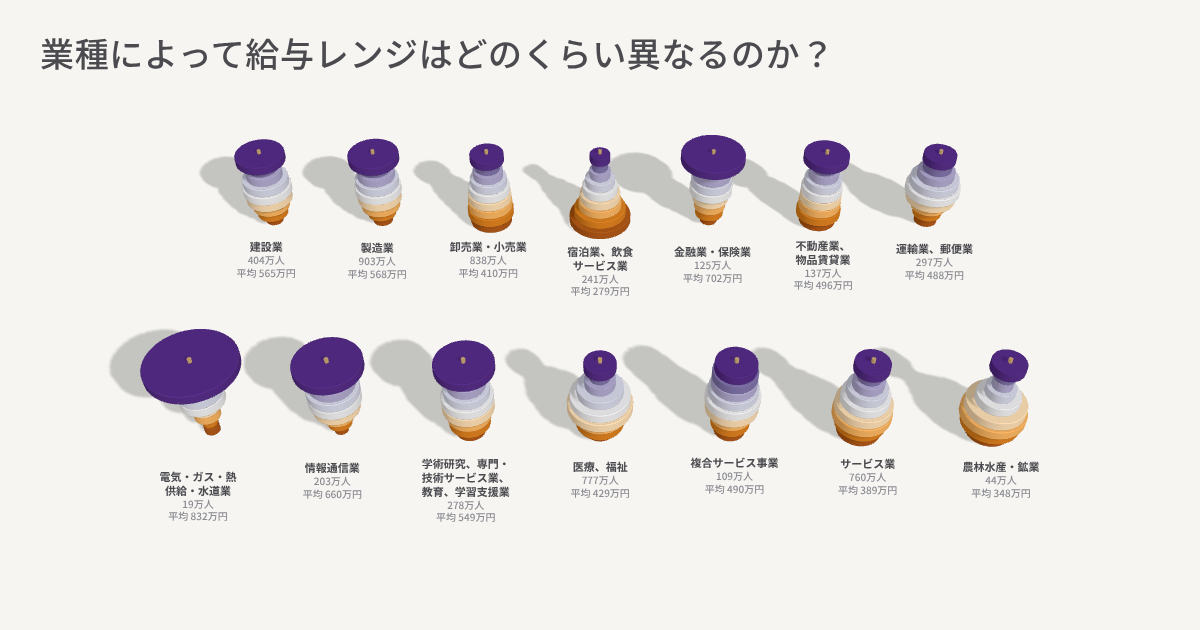
Each stack represents an industry, and each disc represents a salary range. Switch the disc area between headcount and the share of workers in that industry, choose a year, or select an industry to compare men and women. The figures come from Japan’s National Tax Agency survey of private-sector salaries for 2014–2024.