
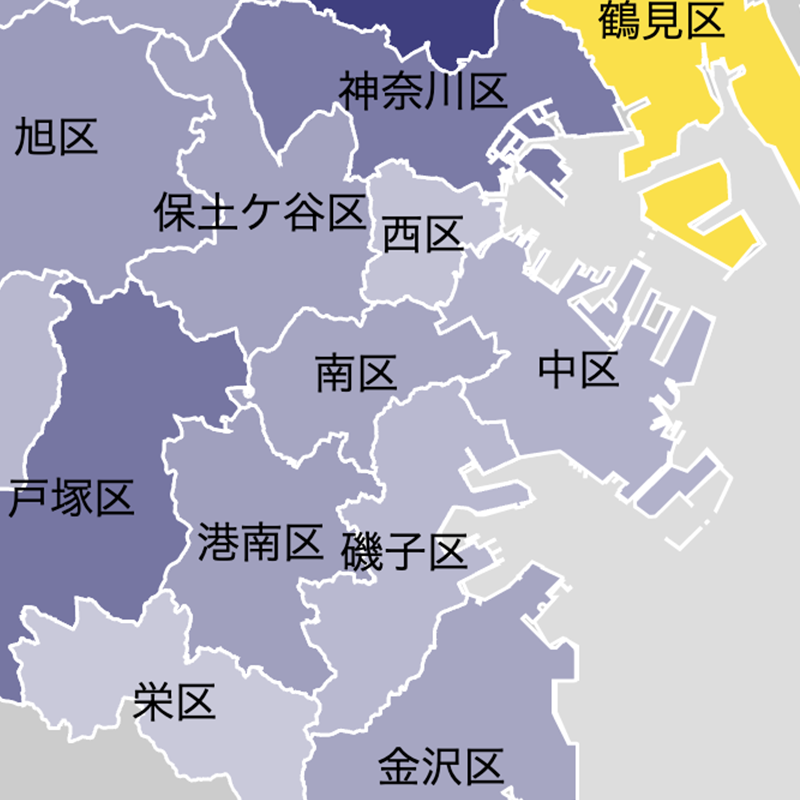
An intuitive view of how Yokohama’s population has changed and is projected to change over the long period from 1955 to 2035, showing a population pyramid and a map side by side.
Publication Date
April 24, 2016
Project Client
Yokohama Community Design Lab
Project Description
Produced as contributed content for “LOCAL GOOD YOKOHAMA,” operated by the Yokohama Community Design Lab. An intuitive view of how Yokohama’s population has changed and is projected to change over the long period from 1955 to 2035, showing a population pyramid and a map side by side.